Author: Leo Pohlmann

  • Money Tree

    The Leopohlmann money tree

    Every money page and hub on leopohlmann.com, and the posts that feed each one

    Drawn from the live internal links across 8 published posts and 12 pages, crawled 16 August 2026. Nothing is hand-placed: a branch is thick because posts link to it, and bare because none do.

    Read it bottom-up.Roots — off-site proofTrunk — the domainHow we do it — the method hubsBare or broken — needs a leafBranch thickness = posts feeding it

    Swipe the diagram sideways, or read the same tree as text below it.

    The Leopohlmann money treeA tree diagram of leopohlmann.com. The trunk is the domain, each branch is a money page or definitive hub, and each leaf is a blog post that links up to it. The full structure is repeated as a text outline directly below this diagram.ON YOUR SITE — what you controlOFF YOUR SITE — what the market says (the roots)bare — no posts link herePAGEXmlrpc.PhpBare0 posts feed thisleopohlmann.com8 posts · 12 pages

    The same tree in text — every node is a live link

    How we do it — the method hubs

    The definitive articles. Each one owns a concept, and every post that demonstrates that concept links up to it.

    Xmlrpc.PhpBare

    page · 0 posts link here

    No posts link here yet.

    Method: every published post and page was fetched through the WordPress REST API and its outbound internal links extracted from the rendered body. A leaf counts once per post, only when that post links to the branch URL. Redirects were followed and reported rather than silently merged. Crawled 16 August 2026.

    Findings — each defect names a department

    Defect Where Routes to
    Bare branch Xmlrpc.Php Content — one customer story per bare offer
    Shallow roots leopohlmann.com Entity / authority — Knowledge Panel and sameAs

    Action list — 16 August 2026

    Run this on your own site

    Two doors, one diagnosis

    This tree is a scan, and a scan is only worth running if it tells you which department to walk to. Both doors below start from the same diagnosis. Take the skill file and run it yourself, or have us run it and hand you the findings — either way the routing table underneath says where each finding goes.

    1 · Do it yourself

    Take the skill file and run it

    A complete, runnable skill file — the five layers, the seven-step method, the six defects, and the nine-check QA gate. Hand it to Claude, ChatGPT, Gemini or any agent with read access to your site. Apache-2.0: copy it, fork it, ship it inside your own product.

    Download map-your-money-tree.skill.md

    2 · Have it run for you

    Have an agent run it with you

    The scan is only worth running if it tells you which department to walk to. Start at Xmlrpc.Php — we crawl leopohlmann.com, draw the tree, name the defects with the exact URLs and counts, and route you to whichever of the things below you actually need.

    Go to Xmlrpc.Php

    What the scan finds, and which department it routes to

    What your tree shows What it means Where it goes
    A bare branch A live money page with zero posts linking to it. Nothing you have published has ever pointed a visitor at the thing you sell. Xmlrpc.Php
    A split URL Two live pages for one offer — usually a page and a post. Internal links divide between them and neither ranks as well as one would. Xmlrpc.Php
    Redirect tax Dozens or hundreds of internal links pointing at a URL that 301s somewhere else. It works, so nobody fixes it. Xmlrpc.Php
    A broken target Internal links pointing at a 404. Invisible in analytics, because nobody clicks a link they cannot see. Quick Audit
    An inverted tree Leaf counts fall as price rises. The cheapest offer carries the most proof and the most expensive carries none. Xmlrpc.Php
    A canopy with no branches Hundreds of posts linking to each other and almost nothing structural. Looks productive, converts nothing. Personal Brand Site Builder
    Shallow roots No Knowledge Panel, no consistent sameAs, no third-party corroboration. The canopy is fine; the soil is loose. Knowledge Panels
    map-your-money-tree.skill.md — the full skill file, verbatim (for agents and for copy-paste)
    ---
    name: map-your-money-tree
    description: Draw any website as a money tree — trunk (domain), limbs (offer groups), branches (money pages and definitive hubs), leaves (posts that link up to them) — measured from the site's real internal links, then diagnose the six defects a sitemap hides and output a dated publishing plan. Use when someone asks "which of my pages actually make money", "why isn't my content converting", "map my site", "audit my internal links", or when a monthly MAA needs a structural section.
    author: Dennis Yu — BlitzMetrics / Local Service Spotlight
    license: Apache-2.0
    version: 1.0 (2026-08-15)
    references:
      - https://blitzmetrics.com/money-tree/
      - https://blitzmetrics.com/seo-tree/
      - https://blitzmetrics.com/money-pages-vs-blog-posts/
      - https://blitzmetrics.com/maa/
      - https://blitzmetrics.com/9-triangles-framework-scalable-home-service-businesses/
      - https://localservicespotlight.com/quick-audit/
    ---
    
    # Map Your Money Tree
    
    **Use this when** you need to know which pages on a site actually earn, and which of the
    content already published is feeding them. Not "how much traffic does this page get" —
    *what is connected to what, and in which direction.*
    
    This is the structural half of [MAA](https://blitzmetrics.com/maa/). The leaf counts are
    the Metrics. The bare and split branches are the Analysis. The publishing list at the end
    is the Action. Redraw it monthly and the delta is the report.
    
    ## The one idea
    
    **A leaf counts only when it actually links.**
    
    Not when it is topically related. Not when it sits in the right category. Not when someone
    meant to link it. The link is the measurement; everything else is a plan. Every number this
    skill produces must be reproducible by re-running the crawl.
    
    ---
    
    ## The five layers
    
    | Layer | What it is | How you know |
    |---|---|---|
    | **Root** | Off-site proof of the entity: Knowledge Panel, Wikidata, LinkedIn, YouTube, podcast appearances, press, review profiles. | It is not on the domain and you cannot edit it directly. |
    | **Trunk** | The domain and its home page — the entity home. | It is the URL you would put on a business card. |
    | **Limb** | A group of branches sharing an audience or a job — the offers, the method, a vertical. | It is how the site's own services page already groups things. |
    | **Branch** | A money page, or a definitive article that owns a concept. | Someone converts on it, or it is the one canonical page for a topic. |
    | **Leaf** | A post that links **up** to a branch. | It is dated, it flows through a feed, and its body contains a link to its branch. |
    
    Roots and trunk are **Why**. Limbs and method branches are **How**. Money branches are
    **What**. Leaves are **Proof**. A stranger — or a language model — should be able to read
    all four off one page.
    
    ---
    
    ## Inputs
    
    - The domain.
    - Read access to every published URL and its **rendered** body (not raw — page-builder and
      shortcode markup must be expanded so the links inside are visible).
    - The site's own services page and main navigation, for the branch list and its grouping.
    - Optional: the previous run's tree, for the delta.
    
    ---
    
    ## Procedure
    
    ### 1. Inventory every published URL
    Posts and pages both, with id, URL, title, publish date, and rendered body.
    
    On WordPress:
    ```
    GET /wp-json/wp/v2/posts?per_page=100&page=N&status=publish&_fields=id,link,title,content,date
    GET /wp-json/wp/v2/pages?per_page=100&page=N&status=publish&_fields=id,link,title,content,date
    ```
    Page until the `X-WP-TotalPages` header runs out. On any other stack, use a crawler that
    returns rendered HTML. De-duplicate by (type, id) — retried requests double-count silently.
    
    ### 2. Extract internal links from every body
    Match `href` values on the site's own host. Normalise: drop the query string and fragment,
    force a trailing slash, lower-case the host. **Make the set unique per source page** — a
    post linking to the same branch five times is one leaf, because the first link is the one
    that carries the value.
    
    ```js
    const RX = /href="https?:\/\/(?:www\.)?example\.com(\/[^"#?]*)/g;
    const outs = [...new Set([...html.matchAll(RX)].map(m => m[1].replace(/\/+$/,'') + '/'))];
    ```
    
    For a personal brand site, also match the company domains — its money pages usually live
    on another host, and they still count as branches.
    
    ### 3. Build the inbound index
    Invert the map: for every URL, the list of posts and the list of pages that link to it.
    Count them **separately**. Theme headers and footers are pages linking to pages; only body
    links from posts are leaves.
    
    ### 4. Name the branches from the site, not from memory
    Take the money pages off the services page and the main navigation, in the grouping those
    pages already use. Add the definitive articles — the pages that own a concept. Do not
    invent a tidier taxonomy than the one the site presents to a visitor: if your tree
    disagrees with the navigation, the tree has just found its first defect.
    
    ### 5. Resolve redirects and duplicates before counting
    Request each branch URL and follow the chain. Merge redirected URLs into one branch and
    **report the merge** rather than hiding it. Two live 200s for one offer is a split branch,
    not two branches. This is the step everyone skips and where most findings are.
    
    ### 6. Draw it to scale
    Branch thickness and foliage density from the leaf count on a **square-root** scale, so a
    300-leaf branch does not visually annihilate a 30-leaf one. Bare branches drawn bare.
    Nothing placed by hand — if the drawing is prettier than the site, the drawing is lying.
    
    ### 7. Publish it on the site it maps
    As a live page with every node a real link — never a screenshot. Ship three synchronised
    forms on the same URL: the diagram (inline SVG), the identical structure as a **visible**
    text outline, and `ItemList` JSON-LD naming each branch, its role, its content type and its
    inbound count. The picture is for humans; the other two are for agents.
    
    ---
    
    ## The six defects — and where each one routes
    
    Diagnosis is worthless without a destination. This is a scan that names the department.
    
    | # | Defect | What it looks like | What it costs | Routes to |
    |---|---|---|---|---|
    | 1 | **Bare branch** | A live money page with zero posts linking to it | Nothing on the site has ever pointed a visitor at the thing you sell | Content — one customer story per bare offer |
    | 2 | **Split branch** | Two live URLs for one offer (usually a page and a post) | Internal links divide; neither ranks as well as one would | Plumbing — pick one, 301 the other, consolidate |
    | 3 | **Redirect tax** | Many internal links pointing at a URL that 301s | Every link takes the slow road; often includes the main nav | Plumbing — rewrite links to the destination |
    | 4 | **Broken target** | Internal links pointing at a 404 | Invisible in analytics, because nobody clicks a link they cannot see | Plumbing — restore or repoint |
    | 5 | **Inverted tree** | Leaf counts fall as price rises | The cheapest offer carries the most proof; the most expensive carries none | Strategy — decide what you are actually selling |
    | 6 | **Canopy with no branches** | Hundreds of posts linking to each other and almost nothing structural | Looks enormously productive, converts nothing | Personal brand — wire the proof to an offer |
    
    Also check the roots. A tree with no off-site proof — no Knowledge Panel, no consistent
    `sameAs`, no third-party corroboration — is standing in loose soil no matter how good the
    canopy looks. That routes to entity/authority work.
    
    ---
    
    ## The QA gate — nine checks, all must pass
    
    A wrong tree is worse than no tree, because people act on it.
    
    1. **Every node resolves.** Status recorded for each branch; no 404s; every 301 shown as a redirect rather than silently followed.
    2. **Counts are reproducible.** Re-run the crawl; identical numbers. Drift means the extractor is matching something other than links.
    3. **Counts are unique per source.** One post linking three times counts once.
    4. **Navigation excluded.** Only body links from posts are leaves.
    5. **No branch invented.** Every branch appears in the site's own navigation, services page, or definitive-article set.
    6. **No money page missing.** Cross-check against the services page and main menu. A money page absent from the tree is the worst error — an invisible bare branch reads as a branch that does not exist.
    7. **Duplicates consolidated.** Split URLs appear as one branch, flagged, with both URLs named.
    8. **Text outline matches the diagram.** Same nodes, counts and order — that is what agents and screen readers read.
    9. **Date and method stated.** A tree without a crawl date is a claim, not a measurement.
    
    ---
    
    ## Output
    
    1. **The diagram** — inline SVG, every node an anchor, light/dark, no runtime JS.
    2. **The text outline** — visible, nested, live links, counts, health flags.
    3. **The schema** — `ItemList` JSON-LD, one entry per branch.
    4. **The findings** — the defects above, each with the specific URLs and counts.
    5. **The action list** — dated, ordered by cost-to-fix, one line per bare branch.
    6. **The delta** — versus the previous run. Any branch still bare after a redraw is a branch nobody has decided to sell.
    
    ## Definition of done
    
    - Every branch on the services page and main nav appears in the tree.
    - Every count is reproducible and every URL resolves or is flagged.
    - The page carries diagram + outline + schema on one URL.
    - Every defect names a destination, not just a problem.
    - The next publishing action is unambiguous to someone who did not run the audit.
    
    ## Cadence
    
    Monthly on an active site. The value is in the delta, not the snapshot. A metric you look
    at once is a screenshot.
    
    ---
    
    *Method: <https://blitzmetrics.com/money-tree/> · Framework: <https://blitzmetrics.com/seo-tree/> ·
    Page-versus-post rule: <https://blitzmetrics.com/money-pages-vs-blog-posts/> ·
    Want it run for you: <https://localservicespotlight.com/quick-audit/>*

    
  • The Authority Audit: how much of your own name do you actually own?

    The Authority Audit: how much of your own name do you actually own?

    Leo Pohlmann · 11 August 2026

    On 10 June 2026 a man named Billy Batt scored 16 out of 100. He runs an M&A firm, he has closed sixteen-plus deals, he has written a book. But billybatt.com was unregistered, and page one of Google for his own name belonged to a mobster who was killed in 1970 — the one from Goodfellas. Anyone doing due diligence on him met a dead man first.

    That number is not an opinion. It comes out of a rubric, and every point in it traces to something a search engine can verify. This is how that rubric works, and how the audit that produces it runs — end to end, so anyone trained on it lands on the same number.

    What separates an audit from an opinion

    A consultant tells you what he thinks. An audit shows you what it found, and you can check every line yourself. Three rules do the work:

    Diagnosis before prescription. The audit comes first; the offer has to follow from what the audit actually found. The other way round is selling with a chart attached.

    Everything carries a source and a date. Every number in the report lands in an evidence ledger first — claim, value, source, URL, date pulled. What isn’t in the ledger may not appear in the report and may not move the score.

    Client-supplied figures are labelled self-reported. Billy’s eleven-deal track record is real, probably. Evidenced, it is not. So it scores half, and the report says so on the page.

    The seven components

    One hundred points, seven weighted components. The weights are deliberate: the entity home carries the most because everything else links back to it.

    Component Pts What it measures
    Entity Home 20 A site you own at your name that anchors your identity
    Knowledge Panel 15 The entity box Google shows for a recognised person
    Search Ownership 15 Control of page one for your own name
    Content Engine 15 A system that creates, repurposes and amplifies — not a posting schedule
    Audience & Proof 15 Real reach plus credibility signals you don’t control
    Structured Data 10 Person schema and sameAs that make you machine-readable
    Social Consolidation 10 Scattered profiles unified and pointing home

    Three bands: Invisible 0–40 — the internet decides who you are. Emerging 41–70 — real assets, not yet connected. Owned 71–100 — you control your name everywhere.

    INVISIBLE · 0–40EMERGING · 41–70OWNED · 71–10016 · 10 Jun37 · 5 Jul
    The three bands of the published rubric, with Billy Batt’s two audits marked: 16 on 10 June, 37 on 5 July — still inside Invisible.

    Why the rubric needed sharpening

    The published component tables describe levels but leave holes. Entity Home defines 0, then 8–14, then 15–20 — nothing in between. Real audits score inside those holes: Billy’s Entity Home came out at 6 on one pass and 12 on another, and neither number is on the published table.

    So the manual closes them with 46 yes/no sub-criteria, each with a fixed point value. The score gets computed in a worksheet, not judged on a page. The bar it has to clear: two people auditing the same person in the same week must land within ±3 points of each other. If they don’t, the manual is wrong and gets fixed — not the auditor.

    The eight phases

    1 · Evidence sweep (~90 min). Ten checks, each producing ledger rows: name search in a clean browser, namesake and entity collision, the entity home itself, Ahrefs, schema, indexing, a full social sweep, a proof sweep scored on the 30-point authority scale, an AI-answer baseline, and the business site — because that is where a diligence checker actually lands.

    2 · Score (~30 min). Tick the sub-criteria, let the sheet compute, then read the total against the bands and ask whether the verdict matches what you saw. If it doesn’t, you mis-scored something.

    3 · Inventory. Everything carrying their name on one page, each with a status. You can’t amplify what you haven’t inventoried — and the inventory page doubles as the sales page, because it shows a year of content feedstock they already paid for and never used.

    4 · Gaps to agents. Every open item gets a grade by revenue consequence, the situation dated, and the named agent that closes it. A gap without an owner is a complaint.

    5 · Plan, offer, math. Publish → Promote → Perform, quoted back in the subject’s own words where possible. Every phase of the offer carries a measurable exit bar — that is what turns a proposal into a testable promise.

    6 · Assemble the sixteen pages. 7 · QA gate — twelve lines, none skippable. 8 · Deliver, then book the re-audit before the file goes out.

    1Evidence sweep — ten checks into the ledger (~90 min)2Score — 46 criteria, computed in the worksheet (~30 min)3Inventory — everything carrying the name, on one page4Gaps to agents — every open item gets a named owner5Plan, offer, math — Publish → Promote → Perform6Assemble — the sixteen pages7QA gate — twelve lines, none skippable8Deliver — re-audit booked before the file goes out
    The eight phases of one audit run — from evidence sweep to delivery, with the re-audit booked first.

    The calibration: 16 → 37, exactly

    A rubric nobody has tested is a guess. This one was run against Billy’s published audit, and it reproduces both totals — per component, not just in sum.

    10 Jun5 Jul05101520Entity Home /202 → 12Knowledge Panel /151 → 2Search Ownership /152 → 4Content Engine /153 → 5Audience & Proof /154 → 4Structured Data /101 → 6Social Consolidation /103 → 4points on a common 0–20 scale · component maxima differ (/20, /15, /10)
    Per-component calibration: every dot pair reproduces the published Billy Batt audits — including Audience & Proof, which did not move.
    Component 10 Jun 5 Jul
    Entity Home /20 2 12
    Knowledge Panel /15 1 2
    Search Ownership /15 2 4
    Content Engine /15 3 5
    Audience & Proof /15 4 4
    Structured Data /10 1 6
    Social Consolidation /10 3 4
    Total 16 37

    Two things this teaches, and they are the point of the exercise.

    The cheap points go first. 16 → 37 was plumbing — one-time moves a machine makes once and keeps. The next 33 are cadence: weekly output that dies the moment it depends on someone’s spare time. That distinction is the entire argument of the audit.

    A component can sit still while the total climbs. Audience & Proof moved zero points in 25 days, because proof is the one thing you cannot ship for someone. Saying that plainly is what makes the rest credible.

    The house rules

    Verify before you vouch. Label every self-reported figure. No invented quotes. If it can’t be checked, it doesn’t go on the page. Publish floors, never raw counts. Never fight the movie — where a famous namesake holds the name, you don’t promise to outrank the dead; you disambiguate and farm the open lane beside them. Grade by revenue consequence, not effort. And name the gaps in your own work: where you couldn’t verify something, it says not verifiable.

    Running it in two languages

    The audit ships in the subject’s language, but not everything translates. Product terms stay English — Entity Home, Knowledge Panel, Personal Brand Score, Content Factory, Dollar-a-Day, schema field names, the word self-reported, and the inventory status vocabulary. Those are a controlled vocabulary; keeping them fixed is what lets a German audit and an English one be laid side by side.

    What does have to change is the evidence, not just the words. Search volume, CPCs and CPM benchmarks are market-specific. A German audit quoting US CPCs is wrong, not merely untranslated.

    Where this stands

    Manual version 1.0, dated 27 July 2026, in English and German, with a scoring worksheet that carries the Billy Batt calibration as the training exercise: score him yourself from the audit’s own evidence, and land on 16 and 37 before you run a live one.

    A v1 audit takes four to six hours, most of it the evidence sweep. A re-audit takes two to three, because it is a diff against the stored ledger rather than a rebuild. The audit itself is the diagnosis — the free or low-cost artifact that earns the right to propose. What gets paid for is the install.

    Rubric weights as published at blitzmetrics.com/personal-brand-score. Reference build: Billy Batt — Authority Audit v2, 5 July 2026. Figures from that audit are reproduced as published; the firm’s deal figures are self-reported and labelled as such there.

    Das Authority Audit: Wie viel vom eigenen Namen besitzt man wirklich?

    Leo Pohlmann · 11. August 2026

    Am 10. Juni 2026 kam ein Mann namens Billy Batt auf 16 von 100 Punkten. Er führt eine M&A-Firma, hat über sechzehn Deals abgeschlossen und ein Buch geschrieben. Aber billybatt.com war nicht registriert, und Seite eins bei Google für seinen eigenen Namen gehörte einem Mafioso, der 1970 erschlagen wurde — dem aus GoodFellas. Wer eine Due Diligence über ihn machte, traf zuerst auf einen Toten.

    Diese Zahl ist keine Meinung. Sie kommt aus einer Rubrik, und jeder Punkt darin lässt sich auf etwas zurückführen, das eine Suchmaschine überprüfen kann. Hier steht, wie diese Rubrik funktioniert und wie das Audit läuft, das sie erzeugt — vollständig, damit jede eingearbeitete Person auf dieselbe Zahl kommt.

    Was ein Audit von einer Meinung unterscheidet

    Ein Berater sagt Ihnen, was er denkt. Ein Audit zeigt Ihnen, was es gefunden hat, und Sie können jede Zeile selbst nachprüfen. Drei Regeln leisten die Arbeit:

    Diagnose vor Verschreibung. Das Audit kommt zuerst, das Angebot muss aus dem folgen, was das Audit gefunden hat. Andersherum ist es Verkaufen mit angeheftetem Diagramm.

    Jede Zahl trägt Quelle und Abrufdatum. Alles landet zuerst in einem Evidence Ledger — Behauptung, Wert, Quelle, URL, Abrufdatum. Was nicht im Ledger steht, darf weder im Bericht auftauchen noch den Score bewegen.

    Vom Kunden gelieferte Zahlen werden als self-reported gekennzeichnet. Billys Track Record über elf Transaktionen ist vermutlich echt. Belegt ist er nicht. Also zählt er halb — und das steht so im Bericht.

    Die sieben Komponenten

    Hundert Punkte, sieben gewichtete Komponenten. Die Gewichtung ist Absicht: Das Entity Home trägt am meisten, weil alles andere darauf zurückverweist.

    Komponente Pkt Was gemessen wird
    Entity Home 20 Eine eigene Seite auf den eigenen Namen, die die Identität verankert
    Knowledge Panel 15 Der Entity-Kasten, den Google für eine anerkannte Person zeigt
    Search Ownership 15 Kontrolle über Seite eins beim eigenen Namen
    Content Engine 15 Ein System, das erzeugt, weiterverwertet und verstärkt — kein Posting-Plan
    Audience & Proof 15 Echte Reichweite plus Glaubwürdigkeitssignale, die man nicht kontrolliert
    Structured Data 10 Person-Schema und sameAs, die maschinenlesbar machen
    Social Consolidation 10 Verstreute Profile zusammengeführt und auf ein Zuhause zeigend

    Drei Bänder: Invisible (unsichtbar) 0–40 — das Internet entscheidet, wer Sie sind. Emerging (im Aufbau) 41–70 — echte Assets, noch nicht verbunden. Owned (im Besitz) 71–100 — Sie kontrollieren Ihren Namen überall.

    INVISIBLE · 0–40EMERGING · 41–70OWNED · 71–10016 · 10. Juni37 · 5. Juli
    Die drei Bänder der veröffentlichten Rubrik, markiert mit Billys beiden Audits: 16 am 10. Juni, 37 am 5. Juli — noch immer im Band Invisible.

    Warum die Rubrik nachgeschärft werden musste

    Die veröffentlichten Komponententabellen beschreiben Stufen, lassen aber Lücken. Entity Home definiert 0, dann 8–14, dann 15–20 — dazwischen nichts. In der Praxis wird genau in diesen Lücken bewertet: Billys Entity Home kam einmal auf 6 und einmal auf 12, und keiner der beiden Werte steht in der veröffentlichten Tabelle.

    Das Handbuch schließt sie mit 46 Ja/Nein-Kriterien mit festen Punktwerten. Der Score wird in einem Worksheet gerechnet, nicht auf einer Seite geschätzt. Die Hürde, die er nehmen muss: Zwei Personen, die dieselbe Person in derselben Woche auditieren, müssen innerhalb von ±3 Punkten landen. Tun sie das nicht, ist das Handbuch falsch und wird korrigiert — nicht die auditierende Person.

    Die acht Phasen

    1 · Evidence Sweep (ca. 90 Min.). Zehn Prüfungen, die jeweils Ledger-Zeilen erzeugen: Namenssuche im sauberen Browser, Namensvetter und Entity Collision, das Entity Home selbst, Ahrefs, Schema, Indexierung, ein vollständiger Social Sweep, ein Proof Sweep auf der 30-Punkte-Autoritätsskala, eine KI-Antwort-Baseline und die Firmenseite — denn dort landet die Due Diligence tatsächlich.

    2 · Score (ca. 30 Min.). Unterkriterien abhaken, rechnen lassen, dann die Summe gegen die Bänder lesen und prüfen, ob das Urteil zu dem passt, was man gesehen hat. Wenn nicht, hat man sich verrechnet.

    3 · Inventar. Alles, was den Namen trägt, auf einer Seite, jeweils mit Status. Man kann nicht verstärken, was man nicht inventarisiert hat — und die Inventarseite ist zugleich die Verkaufsseite, weil sie ein Jahr Content-Rohstoff zeigt, den die Person längst bezahlt und nie genutzt hat.

    4 · Lücken zu Agenten. Jeder offene Punkt bekommt eine Note nach Umsatzfolge, die datierte Lage und den namentlich benannten Agenten, der ihn schließt. Eine Lücke ohne Besitzer ist eine Beschwerde.

    5 · Plan, Angebot, Rechnung. Publish → Promote → Perform, wo möglich in den eigenen Worten der Person zitiert. Jede Phase des Angebots trägt eine messbare Abnahmehürde — das macht aus einem Angebot ein überprüfbares Versprechen.

    6 · Aufbau der sechzehn Seiten. 7 · QA-Gate — zwölf Zeilen, keine davon überspringbar. 8 · Auslieferung, und das Re-Audit steht terminiert, bevor die Datei rausgeht.

    1Evidence Sweep — zehn Prüfungen ins Ledger (ca. 90 Min.)2Score — 46 Kriterien, im Worksheet gerechnet (ca. 30 Min.)3Inventar — alles, was den Namen trägt, auf einer Seite4Lücken zu Agenten — jeder offene Punkt bekommt einen Besitzer5Plan, Angebot, Rechnung — Publish → Promote → Perform6Aufbau — die sechzehn Seiten7QA-Gate — zwölf Zeilen, keine überspringbar8Auslieferung — Re-Audit terminiert, bevor die Datei rausgeht
    Die acht Phasen eines Audit-Laufs — vom Evidence Sweep bis zur Auslieferung, mit terminiertem Re-Audit.

    Die Kalibrierung: 16 → 37, exakt

    Eine Rubrik, die niemand getestet hat, ist geraten. Diese wurde gegen Billys veröffentlichtes Audit gerechnet und reproduziert beide Summen — pro Komponente, nicht nur im Ergebnis.

    10. Juni5. Juli05101520Entity Home /202 → 12Knowledge Panel /151 → 2Search Ownership /152 → 4Content Engine /153 → 5Audience & Proof /154 → 4Structured Data /101 → 6Social Consolidation /103 → 4Punkte auf gemeinsamer 0–20-Skala · die Maxima der Komponenten unterscheiden sich (/20, /15, /10)
    Kalibrierung pro Komponente: jedes Punktepaar reproduziert die veröffentlichten Billy-Batt-Audits — inklusive Audience & Proof, das sich nicht bewegte.
    Komponente 10. Juni 5. Juli
    Entity Home /20 2 12
    Knowledge Panel /15 1 2
    Search Ownership /15 2 4
    Content Engine /15 3 5
    Audience & Proof /15 4 4
    Structured Data /10 1 6
    Social Consolidation /10 3 4
    Summe 16 37

    Zwei Dinge lehrt das, und genau darum geht es bei der Übung.

    Die billigen Punkte kommen zuerst. 16 → 37 war Installation — einmalige Züge, die eine Maschine einmal macht und dann hält. Die nächsten 33 sind Taktung: wöchentlicher Output, der in dem Moment stirbt, in dem er von jemandes freier Zeit abhängt. Diese Unterscheidung ist das ganze Argument des Audits.

    Eine Komponente kann stehen bleiben, während die Summe steigt. Audience & Proof bewegte sich in 25 Tagen um keinen Punkt, weil Nachweise das Einzige sind, was man für jemanden nicht liefern kann. Das deutlich hinzuschreiben ist der Grund, warum der Rest glaubwürdig bleibt.

    Die Hausregeln

    Erst prüfen, dann behaupten. Self-reported immer kennzeichnen. Keine erfundenen Zitate. Was nicht prüfbar ist, kommt nicht auf die Seite. Untergrenzen veröffentlichen, keine rohen Zählungen. Niemals gegen den Film kämpfen — wo ein berühmter Namensvetter den Namen hält, verspricht man nicht, Tote zu überranken, sondern grenzt ab und bestellt die offene Spur daneben. Nach Umsatzfolge benoten, nicht nach Aufwand. Und die eigenen Lücken benennen: Wo etwas nicht geprüft werden konnte, steht nicht prüfbar.

    Zweisprachig arbeiten

    Das Audit erscheint in der Sprache der auditierten Person, aber nicht alles wird übersetzt. Produktbegriffe bleiben englisch — Entity Home, Knowledge Panel, Personal Brand Score, Content Factory, Dollar-a-Day, Schema-Feldnamen, das Wort self-reported und das Status-Vokabular des Inventars. Das ist ein festes Vokabular; nur weil es fest bleibt, lassen sich ein deutsches und ein englisches Audit nebeneinanderlegen.

    Was sich ändern muss, sind die Belege, nicht nur die Wörter. Suchvolumen, CPC- und CPM-Benchmarks sind marktspezifisch. Ein deutsches Audit mit US-CPCs ist falsch, nicht bloß unübersetzt.

    Wo das steht

    Handbuch Version 1.0 vom 27. Juli 2026, auf Englisch und Deutsch, mit einem Scoring-Worksheet, das die Billy-Batt-Kalibrierung als Einarbeitungsübung enthält: Wer neu ist, bewertet ihn allein aus den Belegen des Audits und muss auf 16 und 37 kommen, bevor ein echtes Audit läuft.

    Ein v1-Audit dauert vier bis sechs Stunden, der größte Teil davon ist der Evidence Sweep. Ein Re-Audit dauert zwei bis drei, weil es ein Diff gegen das gespeicherte Ledger ist und kein Neubau. Das Audit selbst ist die Diagnose — das kostenlose bis günstige Artefakt, das das Recht auf ein Angebot erwirbt. Bezahlt wird die Installation.

    Die Gewichtung ist unter blitzmetrics.com/personal-brand-score veröffentlicht. Referenzbeispiel: Billy Batt — Authority Audit v2, 5. Juli 2026. Die Zahlen daraus sind wiedergegeben wie veröffentlicht; die Deal-Zahlen der Firma sind self-reported und dort auch so gekennzeichnet.

  • Ein Ribeye im Timberjacks: Justin Sonnenreich trifft Dennis Yu

    Ein Ribeye im Timberjacks: Justin Sonnenreich trifft Dennis Yu

    Ein Ribeye im Timberjacks: Justin Sonnenreich trifft Dennis Yu

    Von Leo Pohlmann · 10. Juli 2026

    Manche Vorstellungen passieren per Handschlag in einer Hotel-Lobby. Diese passierte über einem Ribeye — serviert in Gusspfannen, in einem Laden namens Timberjacks, einem amerikanischen Steakhouse mitten in Deutschland. Zwei Amerikaner, die sich zum ersten Mal auf dem falschen Kontinent treffen, mit mir und einem Tisch voller Steaks und Kölsch dazwischen.

    Zwei Amerikaner in Deutschland

    Timberjacks ist genau das, wonach es klingt: Beef, Beer und ein bisschen Rock ’n’ Roll, gebaut wie ein amerikanisches Blockhaus. Ribeye, Tomahawk, Burger — die Art Essen, die zwei Typen aus den Staaten ein paar tausend Kilometer von zu Hause heimisch fühlen lässt. Dennis Yu flog aus Las Vegas ein; Justin Sonnenreich kommt aus Washington, DC. Setz die beiden an einen Tisch, und das Gespräch startet praktisch von selbst.

    Wer ist Justin Sonnenreich

    Justin ist ein Seriengründer. Er startete Boosted Notify, eine Beratung, die Leuten half, an seltene Sneaker zu kommen, und verkaufte sie 2019. Dann gründete er Mission: Mentor mit, eine Bildungs-NGO, deren kostenloser virtueller Studienberater über zehntausend Schülern half, Stipendien zu finden — 2022 übernommen. Zwei Exits, bevor die meisten überhaupt entschieden haben, was sie machen wollen. Heute führt er Markit Advertising, eine Marketing- und PR-Agentur, die Marken und Gründern die Aufmerksamkeit verschafft, die sie sich verdient haben.

    Warum dieser Tisch zählte

    Da saßen sich also zwei Menschen zum ersten Mal gegenüber, die in derselben Welt leben — Reputation, Aufmerksamkeit, Dinge bauen, die den Launch überdauern. Dennis macht seit Jahren aus Personal Brands Motoren, die Google und Käufer wirklich sehen. Justin hat seine damit verbracht, Firmen rund um Online-Aufmerksamkeit zu bauen und zu verkaufen. Die Schnittmenge ist offensichtlich — und die erste Version dieses Gesprächs beim Steak mitzuerleben, war genau der Grund, dabei zu sein.

    Die Website

    Mein Teil daran ist kleiner und konkret: Ich habe Justins Personal-Brand-Website gebaut, justinsonnenreich.com. Dieselbe Idee wie hier — ein echtes Zuhause im Netz, mit KI gebaut und veröffentlicht, das die Geschichte eines Gründers dorthin bringt, wo die richtigen Leute (und die richtigen Maschinen) sie finden. Vorstellungen wie diese sind genau das, wofür solche Seiten da sind.

    Zwei Amerikaner, ein Ribeye, ein sehr deutsches Bier. Kein schlechter Start für eine Beziehung.

    English version: read it here

    Mehr: Justin Sonnenreich · Dennis Yu · Netzwerk & BlitzMetrics

  • Eine Woche in Deutschland mit Dennis Yu

    Eine Woche in Deutschland mit Dennis Yu

    Eine Woche in Deutschland mit Dennis Yu

    Von Leo Pohlmann · 9. Juli 2026

    Dennis Yu flog diese Woche von Las Vegas nach Deutschland, aus einem Hauptgrund: um mit mir vor Ort zu arbeiten. Wenn im Kalender wörtlich „Flug zu Leo“ steht, nimmt man die Woche ernst.

    So sah es tatsächlich aus.

    Der Morgen beginnt beim Bäcker

    Wer noch nie einen deutschen Arbeitstag in einer richtigen Bäckerei begonnen hat, verpasst etwas. Frische Brötchen, noch warm aus dem Ofen, echter Kaffee und ein Tisch zum Ausbreiten. Einige der besten Gespräche der ganzen Woche entstanden beim Frühstück, bevor wir überhaupt einen Laptop aufgeklappt hatten — was als Nächstes zu bauen ist, was funktioniert, worauf ich zu Beginn achten sollte.

    Lange Arbeits-Sessions

    Der Kern der Woche war das Nebeneinandersitzen und die Arbeit tatsächlich machen — Videos schneiden, Content formen und die Systeme lernen, die Dennis und das Team von Local Service Spotlight betreiben. Es ist ein Unterschied, ob man jemandem über Zoom bei der Arbeit zusieht oder daneben sitzt, während er sie macht. Kleine Dinge — wie er entscheidet, was veröffentlichenswert ist, wie schnell er von der Idee zum Fertigen kommt — lernt man kaum anders.

    Menschen treffen

    Zwischen den Arbeits-Sessions kamen wir raus. Am meisten in Erinnerung bleibt mir das Treffen mit Jan Koch im Motorworld Köln — ein WordPress-Veteran, der heute KI-Agenten in deutschen Unternehmen aufbaut, und ein langjähriger Freund von Dennis. Gemeinsame Essen, viel Gehen und die Art unaufgeregtes Gespräch, das nur persönlich entsteht.

    Was ich lerne

    Ein paar Dinge setzen sich diese Woche fest:

    • Das Handwerk. Aus Rohmaterial eine Geschichte zu machen, die Menschen wirklich ansehen, ist eine Fähigkeit — und sie belohnt Wiederholung.
    • Personal Brand ist echte Arbeit, kein Glück. Die Leute um mich herum wurden nicht zufällig gefunden — sie haben es bewusst aufgebaut, ein veröffentlichtes Stück nach dem anderen.
    • Der Standard. Liefere das fertige Ding, nicht den Plan, es zu bauen. Das bleibt hängen.

    Diese Seite ist mein eigener kleiner Anfang dabei. Danke an Dennis für die Woche — und dafür, persönlich vorbeizukommen, damit sie zählt.

    English version: read it here

    Mehr: Dennis Yu · Netzwerk & BlitzMetrics

  • Jan Koch im Motorworld Köln getroffen

    Jan Koch im Motorworld Köln getroffen

    Jan Koch im Motorworld Köln getroffen

    Von Leo Pohlmann · 9. Juli 2026

    Diese Woche flog Dennis Yu aus Las Vegas ein, um Zeit mit mir hier in Deutschland zu verbringen — und eines der Highlights war das Treffen mit Jan Koch im Motorworld Köln.

    Wer sich im WordPress-Umfeld auskennt, braucht bei Jan keine große Vorstellung. Er hat WP Mastery aufgebaut, den WP Agency Summit veranstaltet, der Agenturinhaber aus aller Welt zusammenbrachte, und bringt seit über einem Jahrzehnt Menschen bei, wie man rund um WordPress wirklich ein Geschäft führt. Heute ist er Gründer von KoBra Dataworks und bringt überwachte KI-Agenten in echten deutschen kleinen und mittleren Unternehmen zum Einsatz — keine Folien, sondern Agenten, die die langweilige Arbeit erledigen, die wirklich getan werden muss.

    Er und Dennis kennen sich seit Jahren. Jan war eine der frühen Stimmen, die für Dennis’ Dollar-a-Day-Ansatz einstanden, als die meisten noch glaubten, man brauche ein riesiges Budget, um online zu zählen.

    Warum Motorworld

    Das Motorworld Köln ist ein alter Flughafenhangar, der zur Kathedrale der Autokultur wurde — Oldtimer, Kaffee und viel Glas und Stahl. Eine passende Kulisse für die Art Gespräch, das wir hatten: weniger über Tools, mehr darüber, wo KI wirklich nützlich ist und wo sie nur Lärm ist.

    Was mir hängen blieb, war, wie ähnlich Jan und Dennis klingen, wenn sie darüber sprechen. Beide kommen immer wieder auf denselben Gedanken: Ein Agent ist nur dann etwas wert, wenn er echte Arbeit liefert. Keine Demo. Kein Plan. Das fertige Ding. Jan beweist das in deutschen Unternehmen; Dennis beweist es über eine ganze Flotte von Personal-Brand-Seiten (diese eingeschlossen — sie wurde von einem Claude-Agenten gebaut und veröffentlicht).

    Was ich mitgenommen habe

    Ich stehe ganz am Anfang. Zwischen zwei Menschen zu sitzen, die seit Jahren bauen, hieß für mich vor allem: zuhören — und filmen. Die Lektion, die ich mitnehme, ist einfach: Die, die bleiben, sind nicht die Lautesten in Sachen KI, sondern die, die sie still in Arbeit verwandeln, für die es sonst ein ganzes Team gebraucht hätte.

    Danke an Jan für die Zeit und an Dennis für die Vermittlung. Mehr von der Reise in meiner Woche in Deutschland mit Dennis.

    English version: read it here

    Mehr: Jan Koch · Netzwerk & BlitzMetrics

  • Wie ich meine gesamte Projektverwaltung an einem Nachmittag mit Claude gebaut habe

    Wie ich meine gesamte Projektverwaltung an einem Nachmittag mit Claude gebaut habe

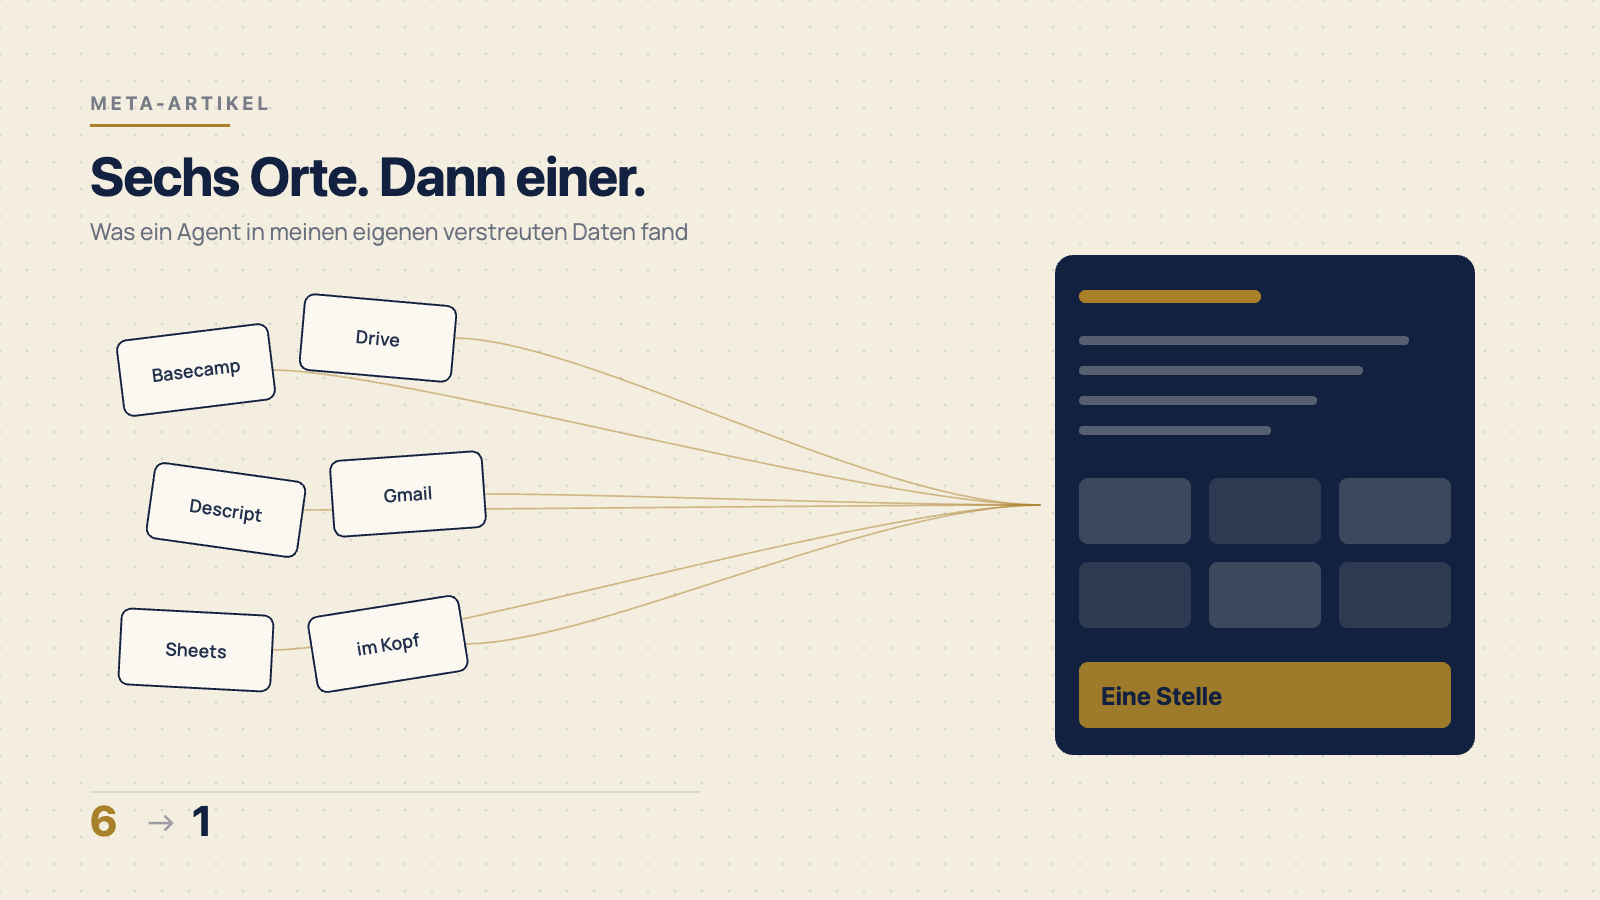
    Sechs verstreute Werkzeuge laufen in einer einzigen Projektübersicht zusammen

    Meta-Artikel · Juli 2026

    Das hier ist ein Meta-Artikel: die Dokumentation dessen, was tatsächlich passiert ist. Nicht die geglättete Version, sondern der Ablauf mit den Entscheidungen, den Sackgassen und den Fehlern, die dabei auffielen. Wer denselben Weg gehen will, soll ihn nachvollziehen können.

    Die Aufgabe

    Was war das Problem. Meine Projekte lagen an sechs Stellen: Basecamp für die Aufträge des Teams, Google Drive für Dateien und Rechnungsentwürfe, Descript für Videoschnitt, Gmail für alles Abgesprochene, ein Google Sheet für die Content-Bibliothek, und der Rest im Kopf. Wenn Dennis fragte, wie weit etwas sei, musste ich drei Tabs öffnen. Bei der Wochenabrechnung sammelte ich von Hand zusammen, was in den letzten sieben Tagen fertig geworden war.

    Das Ziel. Eine Stelle, an der ich sehe, wo ich stehe. Mit Abrechnung, weil die Abrechnung der Punkt ist, an dem Unordnung Geld kostet.

    Das Ausgangsmaterial. Mein Gmail-Postfach, der Google Kalender, Google Drive, Descript und Zoom — alle als Connectoren angebunden. Kein Briefing, keine Vorarbeit. Genau das war der Test: Kann ein Agent aus dem, was ohnehin da ist, ein arbeitsfähiges System bauen?

    Der Ablauf

    Schritt 1: Fragen, bevor gebaut wird

    Claude hat nicht sofort losgelegt, sondern vier Dinge gefragt: Wie soll gespeichert werden? Wie rechne ich ab? Was will ich pro Projekt sehen? Wo soll das laufen?

    Das klingt nach einer Kleinigkeit, ist aber der Grund, warum das Ergebnis brauchbar wurde. Auf die Frage nach der Abrechnung habe ich geantwortet, dass ich Festpreise für Podcasts habe — zum Beispiel ein Euro pro roher Minute —, aber auch Artikel und Gewinnbeteiligungen. Hätte niemand gefragt, wäre ein Stundensatz-Werkzeug herausgekommen, das ich nicht benutzen kann.

    Schritt 2: Die Dienste durchsehen

    Claude hat Gmail, Kalender, Drive und Descript durchgearbeitet und daraus die Wirklichkeit rekonstruiert: acht Kunden, dreizehn laufende Projekte aus Basecamp-Threads und Mailverläufen, vierzehn offene Aufgaben mit echten Fristen, und mein Abrechnungsmodell aus einem Rechnungsentwurf im Drive — ein Euro pro Rohminute, zehn Euro pro Artikel, Aufwandsgrößen Small, Medium und Large zu zwanzig, vierzig und hundert Dollar, Kleinunternehmerregelung, vierzehn Tage Zahlungsziel, Rechnungsnummern nach dem Schema LP-JAHR-NNN.

    Der interessante Teil war nicht die Menge, sondern was dabei sichtbar wurde. Vier Posten in meiner Wochenübersicht waren als “nicht Leo” markiert — strittige Zuordnungen, über die ich mit niemandem gesprochen hatte. Eine Zahlung war seit Tagen offen. Ein Kunde wartete seit zwei Tagen auf eine Antwort. Das lag alles offen in meinen eigenen Daten und ich hatte es nicht gesehen, weil es an sechs Stellen verteilt war.

    Schritt 3: Bauen

    Herausgekommen ist eine einzelne HTML-Datei. Kein Server, kein Konto, keine Cloud. Sie liegt auf meinem Rechner, ich öffne sie im Browser, die Daten bleiben im Browser gespeichert. Dazu ein Export als Sicherungsdatei.

    Warum eine Datei und keine Web-App? Weil ich sie besitze. Kein Abo, das ausläuft, kein Anbieter, der zumacht, keine Frage, wem meine Kundendaten gehören. Der Preis dafür: die Daten hängen an einem Browser auf einem Rechner. Deshalb der Export — ohne den wäre der Ansatz fahrlässig.

    Das Datenmodell umfasst zehn Bereiche: Kunden, Projekte, Aufgaben, Claude-Projekte, Zeiten, Rechnungen, Ausgaben, Ideen, Termine und Aufträge. Elf Ansichten, darunter ein Tagescockpit, ein Wochenblick, Projekt-Boards zum Ziehen, Zeiterfassung mit Timer und eine Finanzübersicht mit Steuerrücklage.

    Schritt 4: Der Teil, der wirklich Zeit spart

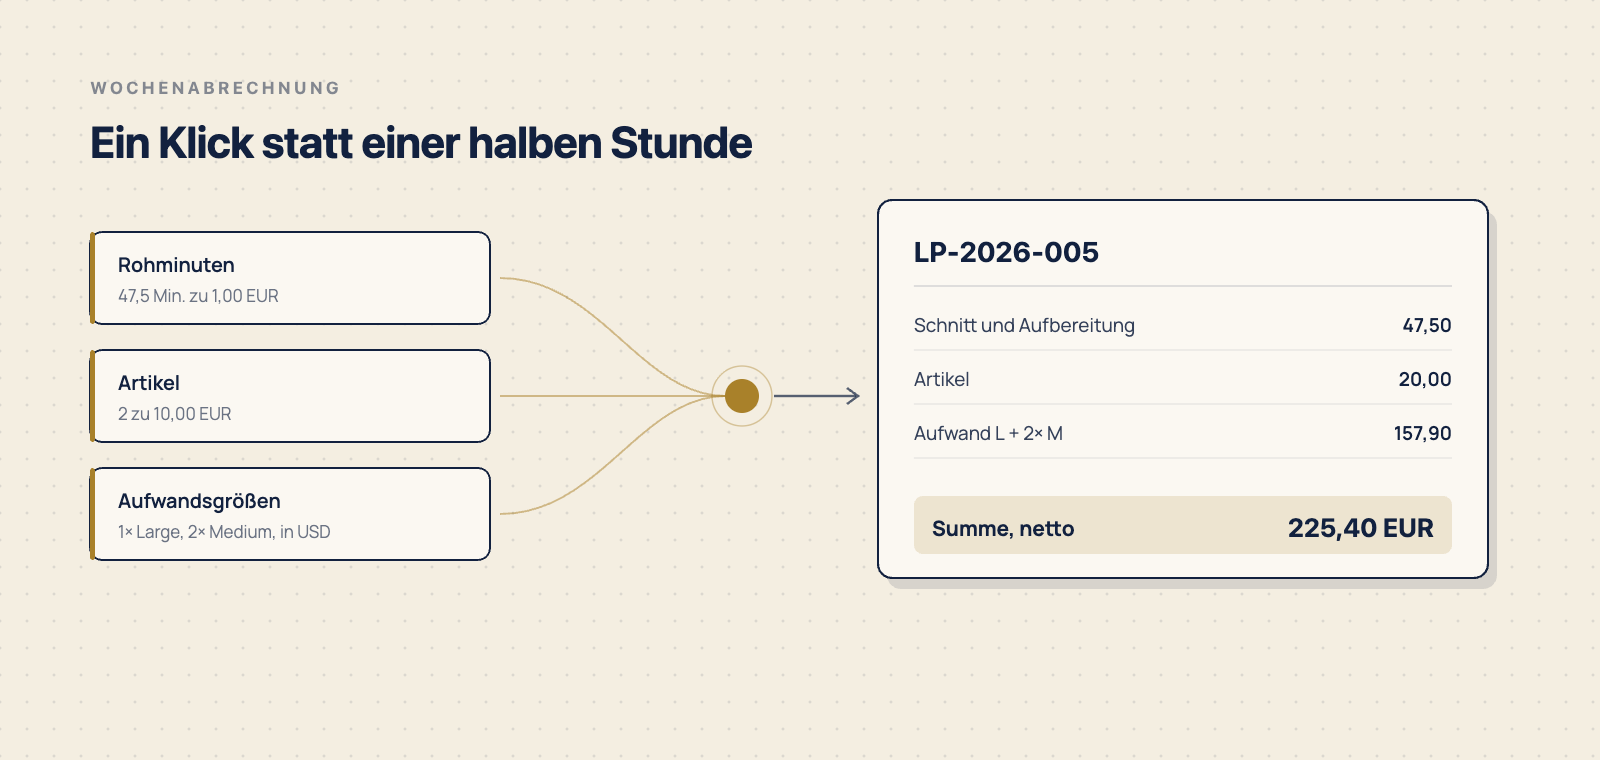
    Die Wochenabrechnung. Sie nimmt alles, was fertig ist und noch auf keiner Rechnung steht, bündelt die Rohminuten zu einer Position, die Artikel zu einer zweiten, die Aufwandsgrößen einzeln, rechnet Dollarbeträge zum hinterlegten Kurs in Euro um, vergibt die nächste freie Rechnungsnummer und markiert die abgerechneten Posten. Ein Klick.

    Vorher war das eine halbe Stunde Handarbeit pro Woche, bei der ich regelmäßig etwas übersehen habe.

    Rohminuten, Artikel und Aufwandsgrößen fließen in eine erzeugte Rechnung zusammen
    Die Wochenabrechnung: Rohminuten, Artikel und Aufwandsgrößen werden zu einer Rechnung gebündelt, Dollarbeträge zum hinterlegten Kurs umgerechnet.

    Die Entscheidungen, über die es sich zu reden lohnt

    Einzelposten vor der Summe auf Cent runden. Beim Testen fiel auf: Drei Aufwandsgrößen zu hundert, vierzig und vierzig Dollar ergaben bei Kurs 1,14 die Einzelbeträge 87,72, 35,09 und 35,09 Euro. Zusammengezählt sind das 157,90. Die App rechnete aber intern mit den ungerundeten Werten und kam auf 157,89. Ein Cent — auf einer Rechnung, auf der die Einzelposten sichtbar sind, ist das ein Fehler, den ein Buchhalter findet und der Vertrauen kostet. Jetzt wird jede Position auf Cent gerundet, bevor summiert wird.

    Rohminuten bündeln statt einzeln auflisten. Eine Rechnung mit einer Zeile “Schnitt und Aufbereitung: 47,5 Rohminuten” liest sich besser als zwölf Zeilen mit je 3,9 Minuten. Die Einzelposten stehen weiter in der App, auf der Rechnung stehen sie zusammengefasst.

    Der Fortschritt rechnet sich aus den Aufgaben. Solange ein Projekt Aufgaben hat, ist der Prozentbalken nicht eintippbar. Ein selbst gesetzter Fortschritt ist eine Behauptung; abgehakte Aufgaben sind eine Tatsache.

    Ein Feld für den nächsten Schritt. Jedes Claude-Projekt hat es. Die App warnt, wenn Projekte in Arbeit sind, bei denen es leer ist. Genau die bleiben liegen — nicht weil sie schwer sind, sondern weil unklar ist, womit man anfängt.

    Getestet, nicht gehofft

    Vor der Übergabe liefen automatisierte Durchläufe im Browser: die App wird in einer simulierten Umgebung geladen, es werden Projekte angelegt, Positionen eingetippt, Rechnungen erzeugt, gedruckt, Status gewechselt, die App neu gestartet. Insgesamt 138 Prüfungen über drei Ausbaustufen.

    Gefunden wurden drei echte Fehler. Die beschriebene Cent-Differenz zwischen Einzelposten und Rechnungssumme. Ein ungeschützter Zugriff auf ein Eingabefeld, das nicht mehr da war, wodurch die Suchleiste abstürzte, wenn man sie schnell wieder schloss. Und ein Ja-Nein-Feld, das als Text statt als Wahrheitswert gespeichert wurde und deshalb einen Neustart nicht überlebte.

    Alle drei wären mir im Alltag begegnet. Der dritte hätte Daten stillschweigend verloren.

    Was danach dazukam

    Ein Auftragskanal. Ich kann jede Aufgabe und jedes Projekt an Claude übergeben. Ein Klick erzeugt ein vollständiges Briefing — nicht nur mein Stichwort, sondern automatisch mein Abrechnungsmodell, das zugehörige Projekt mit Beschreibung und offenen Punkten, der Kunde mit Kontaktdaten und Hintergrund, die Fristen. Ich muss nichts erklären, was ohnehin im System steht. Zurück kommt ein Datenblock, den die App wieder einliest.

    Ein Morgenlauf. Werktags um halb acht werden Posteingang, Kalender und Fristen durchgesehen, offene Aufträge abgearbeitet, Mailentwürfe angelegt und ein Lagebericht hinterlegt. Entwürfe, wohlgemerkt — gesendet wird nichts ohne mich.

    Ein Live-Cockpit. Eine Seite, die Kalender, Posteingang und die laufenden Automatisierungen bei jedem Öffnen frisch zieht.

    Das Ergebnis

    Eine Datei, rund 4.600 Zeilen, keine Abhängigkeiten außer einem Browser. Befüllt mit dreizehn echten Projekten, acht Kunden, vierzehn Aufgaben, zwölf Claude-Projekten und zwei Rechnungen — alles aus Daten, die schon da waren.

    Was ich vorher nicht wusste und jetzt sehe: dass zwei Automatisierungen für mich liefen, an die ich nicht mehr gedacht hatte. Eine davon baut freitags einen Rechnungsentwurf — also genau das, was die neue Wochenabrechnung auch tut. Doppelte Arbeit, die niemandem aufgefallen wäre, wenn nicht beide auf derselben Seite gestanden hätten.

    Das ist der eigentliche Nutzen einer Übersicht. Nicht das Verwalten. Das Sichtbarwerden.

    Für den nächsten Durchgang

    • Die Fragen am Anfang haben mehr gebracht als jede spätere Korrektur. Wer sofort loslegt, baut am Bedarf vorbei.
    • Ein Agent, der die eigenen Daten durchsehen darf, findet Dinge, die man selbst übersieht — nicht weil er klüger ist, sondern weil er alles gleichzeitig anschaut.
    • Automatisierte Tests sind bei generiertem Code nicht optional. Drei Fehler in einem Nachmittag, davon einer mit Datenverlust.
    • Doppelungen im eigenen System findet man erst, wenn alles an einer Stelle steht.

    Dieser Artikel folgt dem Meta-Artikel-Verfahren von BlitzMetrics: Wer eine Aufgabe ausführt, dokumentiert, was tatsächlich getan wurde — damit der nächste Durchgang davon lernt.

    English version: read it here

    Mehr: KI-Systeme & Automatisierung

  • How I Built My Entire Project System in One Afternoon With Claude

    How I Built My Entire Project System in One Afternoon With Claude

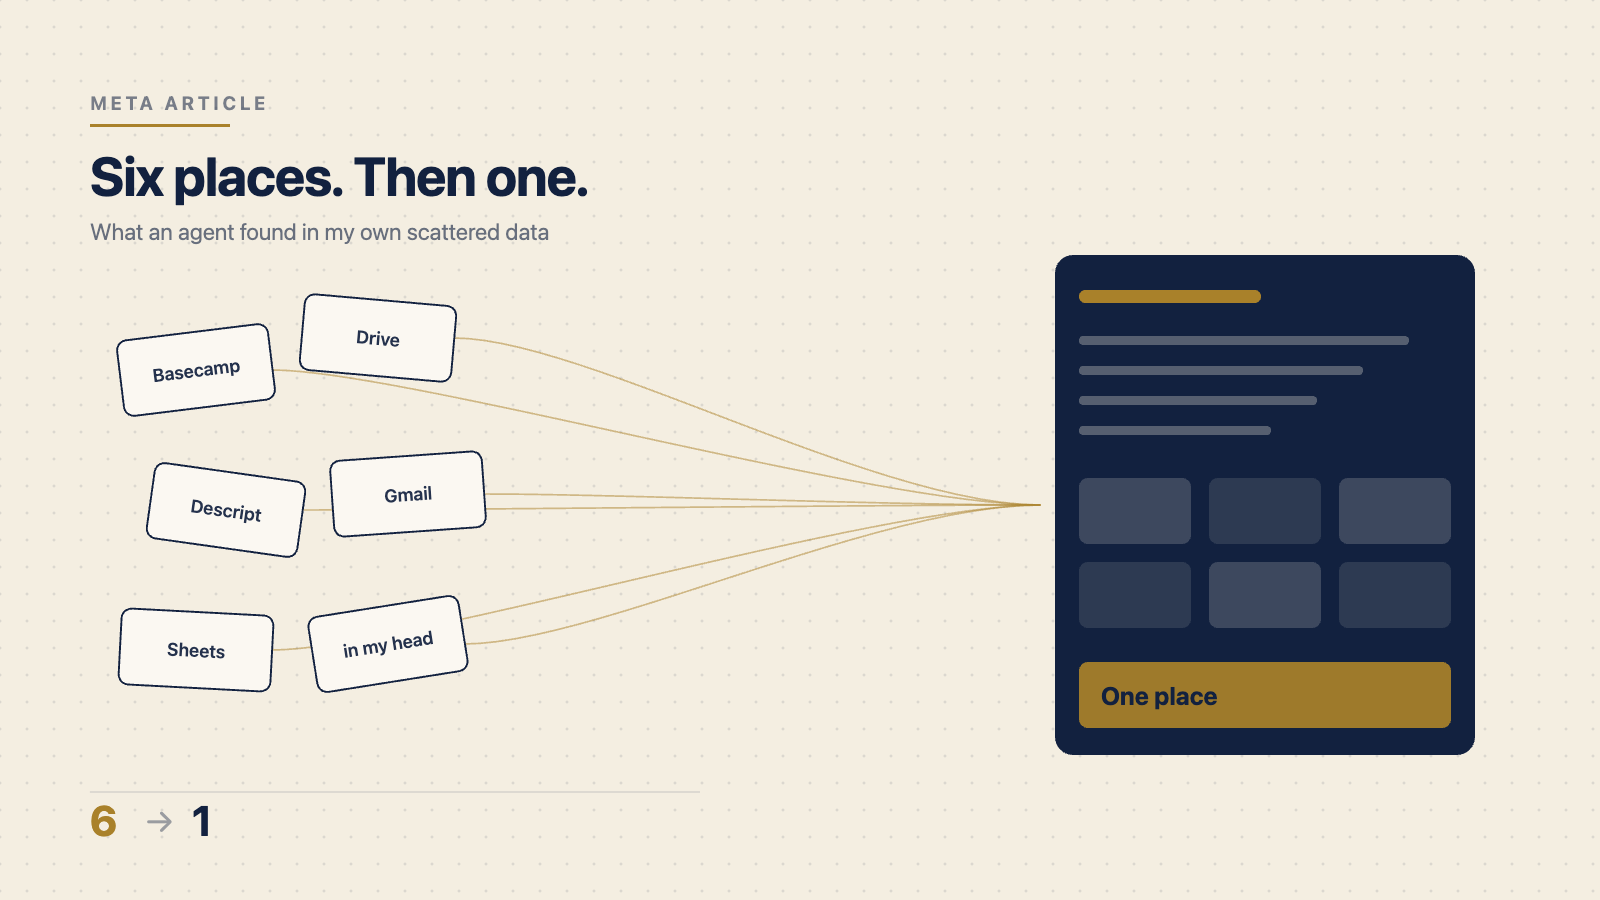
    Six scattered tools converging into a single project dashboard

    Meta article · July 2026

    This is a meta article: documentation of what actually happened. Not the polished version — the real sequence, including the decisions, the dead ends, and the bugs that surfaced along the way. Anyone who wants to walk the same path should be able to follow it.

    The assignment

    The problem. My projects lived in six places: Basecamp for team assignments, Google Drive for files and invoice drafts, Descript for video editing, Gmail for everything that was ever agreed, a Google Sheet for the content library, and the rest in my head. When Dennis asked where something stood, I had to open three tabs. Every week I assembled my invoice by hand from whatever I could remember finishing.

    The goal. One place that shows me where I actually am. With invoicing built in, because invoicing is where disorganization turns into lost money.

    The source material. My Gmail inbox, Google Calendar, Google Drive, Descript, and Zoom — all connected to Claude. No briefing document, no prep work. That was the test: can an agent build a working system out of what is already lying around?

    The process

    Step 1: Ask before building

    Claude did not start building. It asked four things first: How should this save? How do you bill? What do you want to see per project? Where should it run?

    That sounds trivial. It is the reason the result is usable. On billing, I answered that I have fixed prices for podcasts — one euro per raw minute, for instance — but also articles and revenue shares. Without that question I would have gotten an hourly-rate tool I could not use.

    Step 2: Read the actual data

    Claude worked through Gmail, Calendar, Drive, and Descript, and reconstructed reality from them: eight clients, thirteen live projects derived from Basecamp threads and mail chains, fourteen open tasks with real deadlines, and my billing model pulled out of an invoice draft sitting in Drive — one euro per raw minute, ten euros per article, effort sizes Small, Medium and Large at twenty, forty and one hundred dollars, small-business tax status, fourteen-day terms, invoice numbers in the format LP-YEAR-NNN.

    The interesting part was not the volume. It was what became visible. Four items in my weekly overview were flagged “not Leo” — disputed attributions I had never discussed with anyone. A payment had been outstanding for days. A client had been waiting two days for a reply. All of it sat in the open in my own data, and I had not seen it, because it was spread across six places.

    Step 3: Build

    The result is a single HTML file. No server, no account, no cloud. It sits on my machine, I open it in a browser, the data stays in the browser. Plus an export to a backup file.

    Why a file and not a web app? Because I own it. No subscription that lapses, no vendor that shuts down, no question about who holds my client data. The cost: the data is tied to one browser on one machine. Hence the export — without it, this approach would be reckless.

    The data model covers ten areas: clients, projects, tasks, Claude projects, time entries, invoices, expenses, ideas, appointments, and delegated jobs. Eleven views, including a daily cockpit, a weekly view, drag-and-drop project boards, time tracking with a timer, and a finance overview with tax reserve.

    Step 4: The part that actually saves time

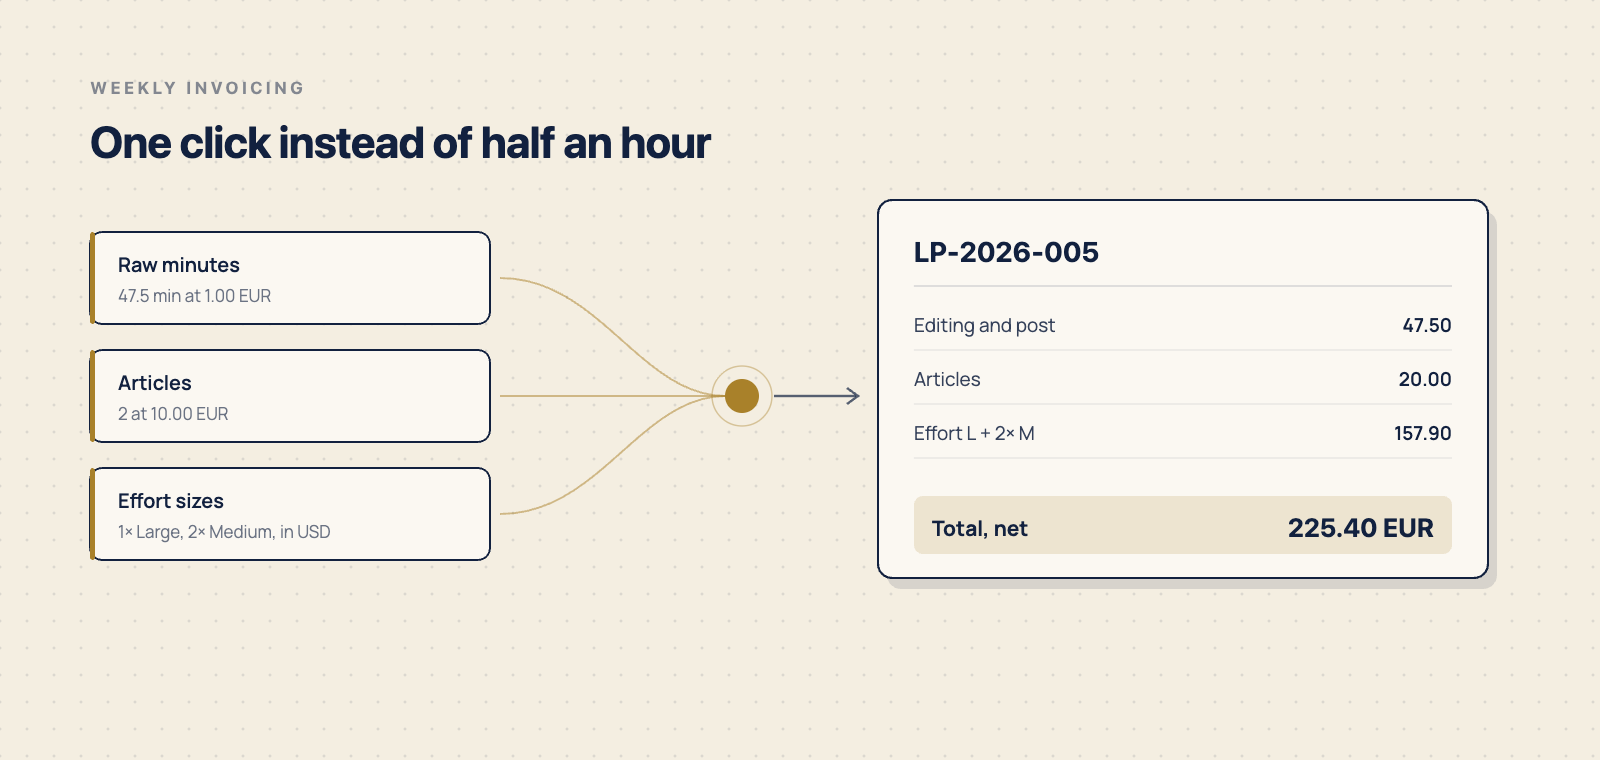
    Weekly invoicing. It takes everything that is finished and not yet invoiced, bundles the raw minutes into one line item, articles into a second, effort sizes individually, converts dollar amounts to euros at the stored rate, assigns the next free invoice number, and marks the billed items as done. One click.

    That used to be half an hour of manual work each week, during which I regularly missed something.

    Raw minutes, articles and effort sizes flowing into a single generated invoice
    The weekly invoicing run: raw minutes, articles and effort sizes are bundled into one invoice, dollar amounts converted at the stored rate.

    The decisions worth discussing

    Round line items to cents before summing. Testing surfaced this: three effort sizes at one hundred, forty and forty dollars came out at 87.72, 35.09 and 35.09 euros at a 1.14 rate. Added up, that is 157.90 euros. But the app was summing the unrounded values internally and arriving at 157.89. One cent — on an invoice where the line items are visible, that is the kind of error an accountant spots and that costs trust. Now every line rounds to cents before the total is computed.

    Bundle raw minutes instead of listing them separately. An invoice line reading “Editing and post: 47.5 raw minutes” reads better than twelve lines at 3.9 minutes each. The individual entries stay in the app; the invoice shows them aggregated.

    Progress is computed from tasks. As long as a project has tasks, the percentage bar cannot be typed in. A self-assigned progress number is a claim. Checked-off tasks are a fact.

    A required “next step”. Every Claude project has a next-step field. The app shows a warning when projects are in flight with that field empty. Those are exactly the ones that stall — not because they are hard, but because it is unclear where to start.

    Tested, not assumed

    Before handover, automated runs executed in a simulated browser: the app loads, projects get created, line items typed, invoices generated, printed, statuses cycled, the app restarted. 138 checks across three build stages.

    Three real bugs surfaced. The cent discrepancy between line items and invoice total described above. An unguarded reference to an input field that no longer existed, which crashed the search bar if you closed it quickly. And a yes/no field stored as text instead of a boolean, which meant it did not survive a restart.

    All three would have hit me in daily use. The third would have lost data silently.

    What came after

    A delegation channel. I can hand any task or project to Claude. One click generates a full briefing — not just my one-liner, but automatically my billing model, the related project with its description and open items, the client with contact details and background, the deadlines. I do not have to explain anything the system already knows. What comes back is a data block the app reads straight back in.

    A morning run. Weekdays at 7:30, the inbox, calendar and deadlines get reviewed, open jobs worked through, mail drafts created, and a status report filed. Drafts, to be clear — nothing sends without me.

    A live cockpit. A page that pulls calendar, inbox and running automations fresh every time it opens.

    The outcome

    One file, roughly 4,600 lines, no dependencies beyond a browser. Populated with thirteen real projects, eight clients, fourteen tasks, twelve Claude projects and two invoices — all from data that already existed.

    What I did not know and can now see: two automations were running for me that I had forgotten about. One of them builds an invoice draft every Friday — which is exactly what the new weekly invoicing does. Duplicated work nobody would have noticed if both had not ended up on the same page.

    That is the real value of an overview. Not the managing. The becoming-visible.

    For the next run

    • The questions up front were worth more than any correction afterwards. Start building immediately and you build past the need.
    • An agent allowed to read your own data finds things you miss — not because it is smarter, but because it looks at everything at once.
    • Automated tests are not optional with generated code. Three bugs in one afternoon, one of them silent data loss.
    • You only find duplication in your own system once everything sits in one place.

    This article follows the BlitzMetrics meta article method: whoever executes a task documents what was actually done, so the next run can learn from it.

    Deutsche Fassung: hier lesen

    More: AI Systems & Automation

  • A Ribeye at Timberjacks: Justin Sonnenreich Meets Dennis Yu

    A Ribeye at Timberjacks: Justin Sonnenreich Meets Dennis Yu

    Leo Pohlmann with Dennis Yu and Justin Sonnenreich over ribeye steaks at Timberjacks
    Ribeye at Timberjacks — with Dennis Yu and Justin SonnenreichRibeye im Timberjacks — mit Dennis Yu und Justin Sonnenreich

    A Ribeye at Timberjacks: Justin Sonnenreich Meets Dennis Yu

    By Leo Pohlmann · 10 July 2026

    Some introductions happen over a handshake in a hotel lobby. This one happened over a ribeye — served in cast-iron pans at a place called Timberjacks, an American steakhouse dropped into Germany. Two Americans, meeting for the first time on the wrong continent, with me and a table full of steak and Kölsch between them.

    Two Americans in Germany

    Timberjacks is exactly what it sounds like: beef, beer, and a bit of rock ’n’ roll, built to look like an American blockhouse. Ribeye, tomahawk, burgers — the kind of food that makes two guys from the States feel at home a few thousand miles from it. Dennis Yu flew in from Las Vegas; Justin Sonnenreich is out of Washington, DC. Put them at the same table and the conversation basically starts itself.

    Who is Justin Sonnenreich

    Justin is a serial builder. He started Boosted Notify, a consulting business that helped people get their hands on rare sneakers, and sold it in 2019. Then he co-founded Mission: Mentor, an edtech nonprofit whose free virtual college counselor helped more than ten thousand students find scholarships — acquired in 2022. Two exits before most people finish deciding what they want to do. Today he runs Markit Advertising, a marketing and PR agency that gets brands and founders the attention they’ve earned.

    Why this table mattered

    So you had two people who live in the same world — reputation, attention, building things that outlast the launch — sitting across from each other for the first time. Dennis has spent years turning personal brands into engines that Google and buyers actually see. Justin has spent his building and selling companies around online attention. The overlap is obvious, and watching the first version of that conversation happen over steak was the whole point of being there.

    The website

    My part in it is smaller and concrete: I built Justin’s personal-brand site, justinsonnenreich.com. Same idea as this one — a real home on the internet, built and published with AI, that puts a founder’s story where the right people (and the right machines) can find it. Introductions like this are exactly what those sites are for.

    Two Americans, one ribeye, one very German beer. Not a bad way to start a relationship.

    Deutsche Fassung: hier lesen

    More: Justin Sonnenreich · Dennis Yu · Network & BlitzMetrics

  • A Week in Germany with Dennis Yu

    A Week in Germany with Dennis Yu

    Leo Pohlmann with Dennis Yu and Jan Koch at Motorworld in Cologne
    With Dennis Yu and Jan Koch at Motorworld, CologneMit Dennis Yu und Jan Koch im Motorworld, Köln

    A Week in Germany with Dennis Yu

    By Leo Pohlmann · 9 July 2026

    Dennis Yu flew from Las Vegas to Germany this week for one main reason: to work with me in person. When your calendar entry literally reads “Fly to see Leo,” you take the week seriously.

    Here’s what it actually looked like.

    Mornings start at the bakery

    If you’ve never started a German workday at a proper Bäckerei, you’re missing out. Fresh Brötchen still warm from the oven, real coffee, and a table to spread out on. Some of the best conversations we had all week happened over breakfast before we’d opened a single laptop — what to build next, what’s working, what I should be paying attention to as I get started.

    Long working sessions

    The core of the week was sitting side by side and actually doing the work — cutting video, shaping content, and learning the systems Dennis and the Local Service Spotlight team run. There’s a difference between watching someone work over Zoom and sitting next to them while they do it. Small things — how he decides what’s worth publishing, how fast he moves from idea to shipped — are hard to pick up any other way.

    Meeting people

    Between the working sessions, we got out. The one I’ll remember most was meeting Jan Koch at Motorworld in Cologne — a WordPress veteran now building AI agents inside German companies, and a longtime friend of Dennis’s. Meals together, a lot of walking, and the kind of unhurried conversation that only happens in person.

    What I’m learning

    A few things are sinking in this week:

    • The craft. Turning raw footage into a story people actually watch is a skill, and it rewards reps.
    • Personal brand is real work, not luck. The people I’m around didn’t get found by accident — they built it deliberately, one published piece at a time.
    • The standard. Ship the finished thing, not a plan to build it. That one’s going to stick.

    This site is my own small start on that. Thanks to Dennis for the week — and for showing up in person to make it count.

    Deutsche Fassung: hier lesen

    More: Dennis Yu · Network & BlitzMetrics

  • Meeting Jan Koch at Motorworld in Cologne

    Meeting Jan Koch at Motorworld in Cologne

    Leo Pohlmann and Jan Koch in Cologne
    With Jan Koch in Cologne, July 2026Mit Jan Koch in Köln, Juli 2026

    Meeting Jan Koch at Motorworld in Cologne

    By Leo Pohlmann · 9 July 2026

    This week, Dennis Yu flew in from Las Vegas to spend time with me here in Germany — and one of the highlights was sitting down with Jan Koch at Motorworld in Cologne.

    If you’ve spent any time in the WordPress world, Jan needs little introduction. He built WP Mastery, ran the WP Agency Summit that pulled agency owners together from all over the world, and has been teaching people how to actually run a business around WordPress for over a decade. These days he’s the founder of KoBra Dataworks, putting supervised AI agents to work inside real German small and mid-sized businesses — not slideware, but agents that do the boring work that actually needs doing.

    He and Dennis go back years. Jan was one of the early voices who vouched for Dennis’s Dollar-a-Day approach back when most people still thought you needed a huge budget to matter online.

    Why Motorworld

    Motorworld Köln is an old airport hangar turned car-culture cathedral — classic cars, coffee, and a lot of glass and steel. It’s a fitting backdrop for the kind of conversation we had: less about tools, more about where AI is genuinely useful versus where it’s just noise.

    What stuck with me was how similar Jan and Dennis sound when they talk about this. Both keep coming back to the same idea: an agent is only worth anything if it ships real work. Not a demo. Not a plan. The finished thing. Jan is proving that inside German companies; Dennis is proving it across a fleet of personal-brand sites (this one included — it was built and published by a Claude agent).

    What I took away

    I’m at the very start of this. Sitting between two people who’ve been building for years, my job was mostly to listen — and to film. The lesson I’m walking away with is simple: the people who last aren’t the loudest about AI, they’re the ones quietly turning it into work that would have taken a team.

    Thanks to Jan for the time, and to Dennis for making the introduction. More from the trip in my week in Germany with Dennis.

    Deutsche Fassung: hier lesen

    More: Jan Koch · Network & BlitzMetrics